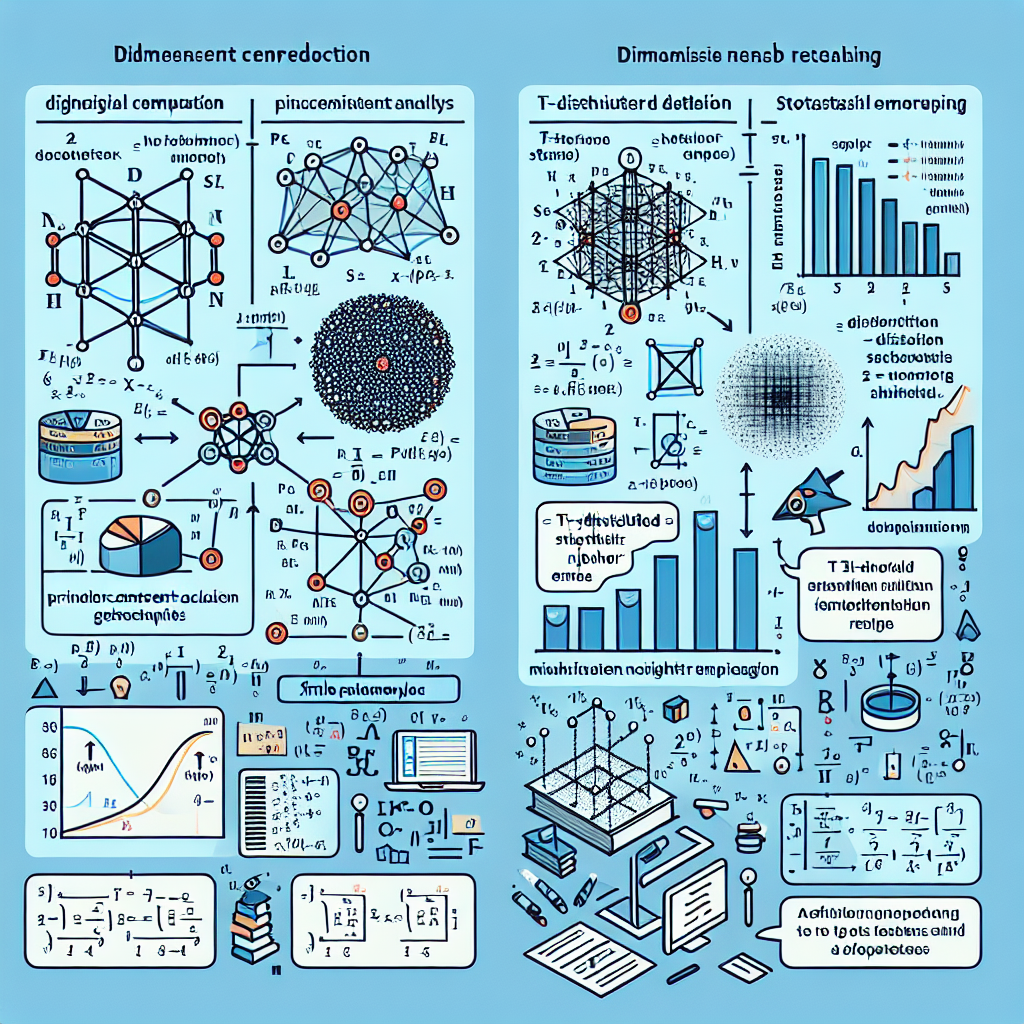
Dimensionality reduction is a crucial technique that helps simplify complex datasets while retaining their essential features. Among the various methods available, Principal Component Analysis (PCA) and t-Distributed Stochastic Neighbor Embedding (t-SNE) are two of the most widely used techniques. This article delves into these methods, explaining their principles, applications, and differences, providing valuable insights for data practitioners.
Understanding Dimensionality Reduction
Dimensionality reduction refers to the process of reducing the number of random variables under consideration, obtaining a set of principal variables. This is particularly important in high-dimensional datasets where the curse of dimensionality can lead to overfitting and increased computational costs. The primary goals of dimensionality reduction include:
- Improving model performance by reducing noise and redundancy.
- Enhancing data visualization by projecting high-dimensional data into lower dimensions.
- Facilitating faster computation and storage efficiency.
Principal Component Analysis (PCA)
PCA is a linear dimensionality reduction technique that transforms the data into a new coordinate system. The new axes, known as principal components, are ordered by the amount of variance they capture from the data. Here’s how PCA works:
- Standardization: The data is centered and scaled to have a mean of zero and a standard deviation of one.
- Covariance Matrix Computation: A covariance matrix is computed to understand how variables relate to one another.
- Eigenvalue Decomposition: Eigenvalues and eigenvectors of the covariance matrix are calculated to identify the principal components.
- Projection: The original data is projected onto the selected principal components to reduce dimensionality.
PCA is particularly effective in scenarios where linear relationships exist among variables. For instance, in image processing, PCA can be used to reduce the dimensionality of image data while preserving essential features, making it easier to analyze and visualize.
t-Distributed Stochastic Neighbor Embedding (t-SNE)
t-SNE is a non-linear dimensionality reduction technique that excels in visualizing high-dimensional data. Unlike PCA, which focuses on variance, t-SNE emphasizes preserving local structures in the data. The process involves:
- Pairwise Similarity Calculation: t-SNE computes the similarity between data points in high-dimensional space using a Gaussian distribution.
- Low-Dimensional Mapping: It then maps these similarities to a lower-dimensional space using a Student’s t-distribution, which helps maintain local relationships.
- Optimization: The algorithm iteratively adjusts the low-dimensional representation to minimize the divergence between the high-dimensional and low-dimensional distributions.
t-SNE is particularly useful in exploratory data analysis and visualization tasks. For example, it has been widely used in genomics to visualize gene expression data, revealing clusters of similar gene profiles that may indicate biological significance.
Comparing PCA and t-SNE
While both PCA and t-SNE serve the purpose of dimensionality reduction, they have distinct characteristics and use cases:
- Linear vs. Non-Linear: PCA is a linear method, making it suitable for linearly separable data, while t-SNE is non-linear and better for complex datasets with intricate structures.
- Interpretability: PCA provides interpretable components that can be understood in terms of original features, whereas t-SNE focuses on visualization and may not yield interpretable axes.
- Computational Efficiency: PCA is generally faster and more efficient for large datasets, while t-SNE can be computationally intensive, especially with large numbers of data points.
Conclusion
Dimensionality reduction techniques like PCA and t-SNE are invaluable tools in the data scientist’s toolkit. PCA is ideal for linear data and offers interpretability, while t-SNE shines in visualizing complex, non-linear relationships. Understanding the strengths and limitations of each method allows practitioners to choose the appropriate technique based on their specific data and analysis goals. As data continues to grow in complexity, mastering these techniques will be essential for effective data analysis and visualization.
“`
