In this proof of concept, we embarked on an exciting journey to analyze the sentiment of tweets related to the movie “Avengers Endgame” using Python. This exercise demonstrates the powerful capabilities of natural language processing (NLP) and sentiment analysis, showcasing how businesses and individuals can glean valuable insights from social media data.
Use Case: Why Sentiment Analysis Matters
Sentiment analysis is a crucial tool for understanding public opinion and trends across various industries. Whether you’re a brand looking to gauge customer satisfaction, a political analyst monitoring public sentiment during elections, or a movie studio measuring audience reactions to a film, sentiment analysis provides real-time insights that can inform decision-making and strategy.
For this specific proof of concept, we focused on the entertainment industry by analyzing tweets about the blockbuster film “Avengers Endgame.” This type of analysis can be invaluable for studios and marketing teams to understand audience reactions, identify trending topics, and respond promptly to public feedback.
Technologies and Libraries Used
To achieve our sentiment analysis goals, we utilized the following technologies and Python libraries:
- Python: The core programming language used to orchestrate the entire sentiment analysis process.
- Pandas: A powerful data manipulation library, used for reading, processing, and managing the Twitter data stored in CSV format.
- NLTK (Natural Language Toolkit): Specifically, the VADER (Valence Aware Dictionary and sEntiment Reasoner) sentiment analysis tool, which is a lexicon and rule-based sentiment analysis library that is sensitive to the polarity (positive/negative) and intensity (strength) of emotions expressed in social media texts.
- Matplotlib: A plotting library for creating static, animated, and interactive visualizations in Python. In this proof of concept, we used Matplotlib to create a histogram that visualizes the distribution of sentiment across the analyzed tweets.
Methodology
-
Data Collection: We started by loading a CSV file containing tweets about “Avengers Endgame.” These tweets were fetched from Twitter and stored in a structured format that included fields such as the tweet text, retweet count, favorite count, and more.
-
Sentiment Analysis: We used the VADER sentiment analyzer from the NLTK library to evaluate the sentiment of each tweet. VADER is particularly suited for social media analysis as it can interpret the subtle nuances of natural language, including slang, emojis, and exclamation marks.
-
Categorizing Sentiment: Each tweet was assigned a sentiment score, which was then categorized into one of three categories: Positive, Negative, or Neutral. This categorization helps in understanding the overall tone of the tweets.
-
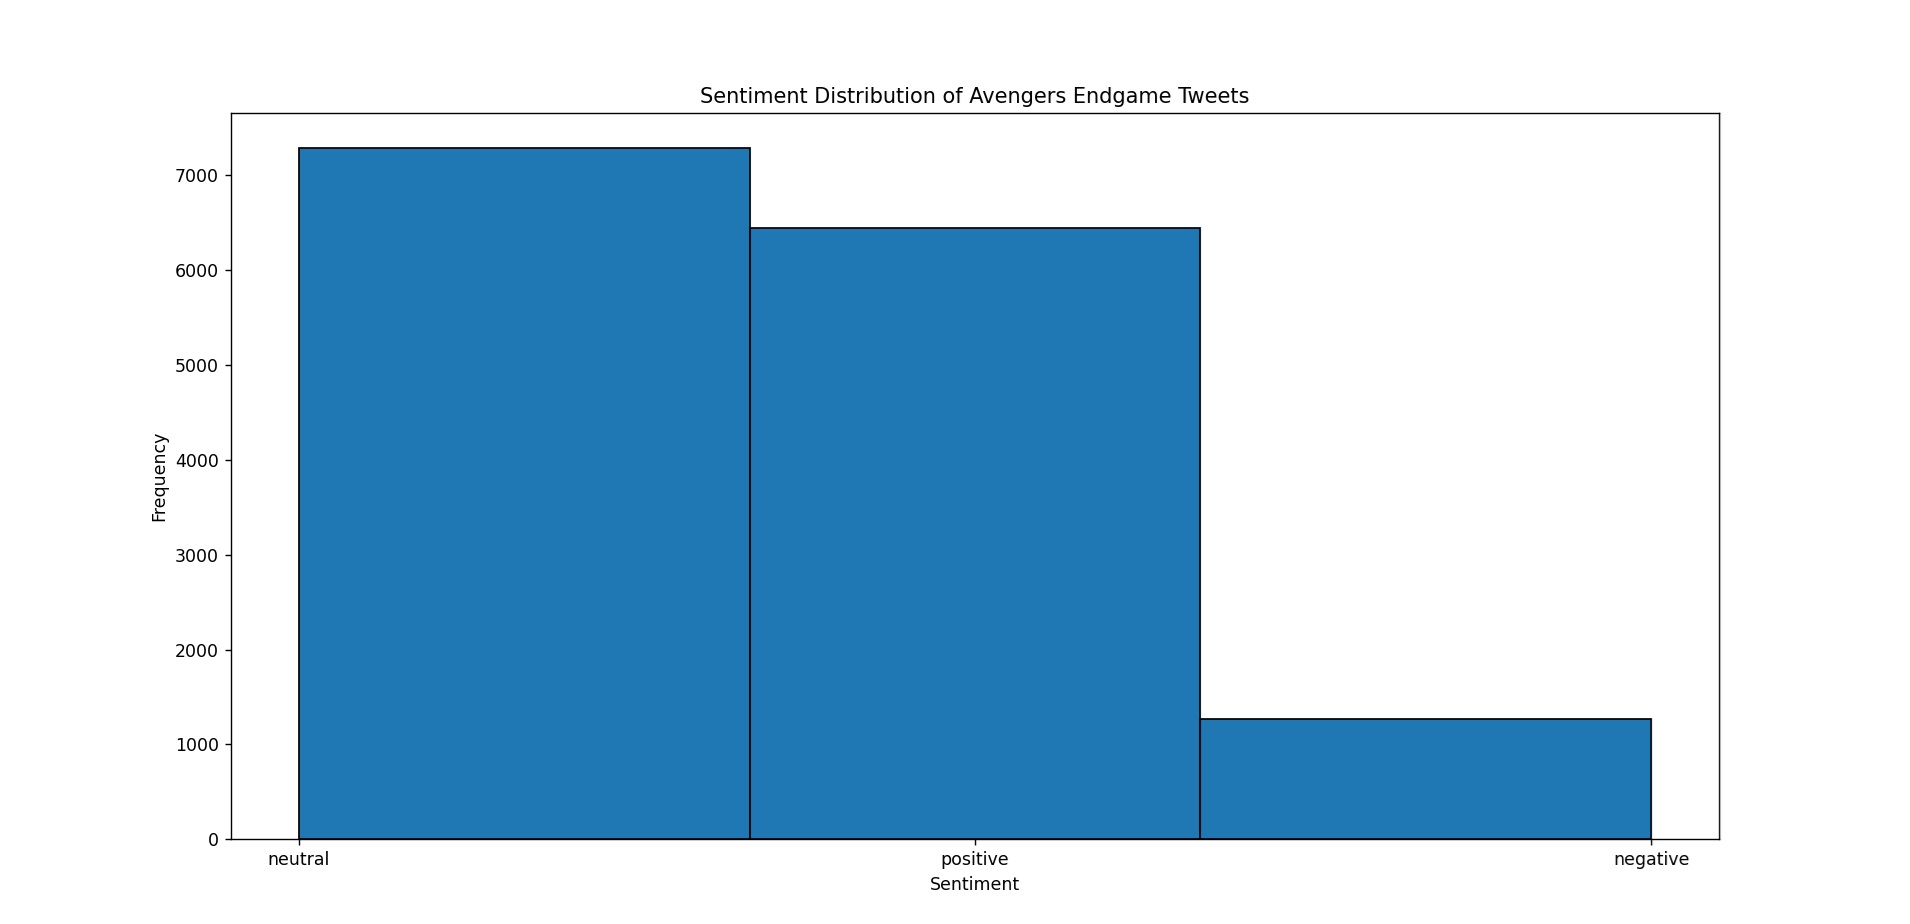
Visualization: To provide a clear and intuitive understanding of the sentiment distribution, we plotted a histogram using Matplotlib. This visual representation helps in quickly assessing the general sentiment trend among the analyzed tweets.
Results
The analysis successfully categorized the tweets into positive, negative, and neutral sentiments, providing a snapshot of public opinion surrounding “Avengers Endgame.” The histogram offered a visual breakdown, showcasing the prevalence of each sentiment category. Such insights can be critical for marketing strategies, audience engagement, and brand management.
Conclusion
This proof of concept highlights the potential of sentiment analysis in understanding public sentiment through social media data. By leveraging Python and its rich ecosystem of libraries, we were able to efficiently process and analyze a large dataset of tweets, providing actionable insights for stakeholders.
As businesses continue to navigate the complexities of consumer behavior and public opinion, sentiment analysis will remain a powerful tool in the arsenal of data-driven decision-making. Whether you are in entertainment, politics, retail, or any other industry, understanding your audience’s emotions and reactions is key to success.

Summary of the Libraries Used for the Sentiment Analysis Project:
- NLTK (Natural Language Toolkit):
- Purpose: NLTK is a comprehensive library for natural language processing (NLP) in Python. It includes a wide range of tools for tasks such as text processing, tokenization, and sentiment analysis.
- Usage in This Project: We specifically used NLTK’s VADER (Valence Aware Dictionary and sEntiment Reasoner) sentiment analysis tool to analyze the sentiment of the text data. VADER is designed to handle social media text and is capable of identifying positive, neutral, and negative sentiments in short phrases.
- Key Functionality:
- SentimentIntensityAnalyzer: This tool from the VADER module provides sentiment scores for text, including positive, neutral, negative, and compound scores.
- Pandas:
- Purpose: Pandas is a powerful data manipulation and analysis library for Python. It provides data structures like DataFrames, which are perfect for handling and analyzing structured data.
- Usage in This Project: Pandas was used to store the sentiment analysis results in a structured format (CSV) and to manipulate the data for further analysis and visualization.
- Key Functionality:
- DataFrame: A two-dimensional, size-mutable, and potentially heterogeneous tabular data structure with labeled axes.
- read_csv(): Used to read a CSV file into a DataFrame.
- to_csv(): Used to save a DataFrame to a CSV file.
- Matplotlib:
- Purpose: Matplotlib is a plotting library for Python that allows for the creation of static, animated, and interactive visualizations.
- Usage in This Project: We used Matplotlib to visualize the sentiment analysis results by creating a histogram that displays the distribution of sentiment scores.
- Key Functionality:
- hist(): Creates a histogram to visualize the frequency distribution of data.
- title(), xlabel(), ylabel(): These functions add titles and labels to the plots to make them more informative.
Explanation of How These Libraries Work Together:
- NLTK (VADER): This library performed the core task of sentiment analysis, processing each piece of text and assigning a sentiment score based on the content.
- Pandas: After NLTK processed the text, Pandas was used to organize the results into a structured DataFrame, which was then saved as a CSV file for easy access and further analysis.
- Matplotlib: Finally, Matplotlib took the structured data provided by Pandas and visualized it, allowing us to see the overall sentiment distribution in a clear and interpretable format.
This combination of libraries provided a robust framework for performing sentiment analysis, handling data efficiently, and creating visual insights that are crucial for understanding the results.
